
 By Kent Morgan
You can have a beautiful listing, five-star reviews, and still lose money — because the calendar sits empty three weeks out of four. Airbnb occupancy rate is the number that exposes it. It tells you what share of your available nights actually sold, and it is the first metric any professional manager looks at before touching price, photos, or amenities.
This guide covers the formula, average Airbnb occupancy rates by city in 2026, what counts as a good rate, where to find real occupancy data for your own market, and the levers that move the number.
Market figures in this guide are sourced and dated below; the worked examples are illustrative and marked with ~.
What Is Airbnb Occupancy Rate? Formula and Definition
Airbnb occupancy rate is the percentage of your available nights that were booked by paying guests in a given period. The formula is short:
- Occupancy rate = (booked nights ÷ available nights) × 100
- Booked nights: nights a paying guest actually stayed
- Available nights: nights the listing was open for booking — not nights you blocked for yourself
In plain English: think of your listing as a small hotel with one room. If the room could have sold 30 nights in June and sold 18, your occupancy rate is 60%. The nights you blocked for family do not count against you — they were never for sale.
That distinction matters more than hosts expect. Two listings can report the same occupancy rate while one sold 18 of 30 nights and the other sold 9 of 15. The percentage is identical; the revenue is not.
The metric goes by several names and they all mean the same calculation: vacation rental occupancy rate, short term rental occupancy rate, or informally the Airbnb rental percentage. Whichever term a data provider uses, check the denominator before comparing — some count every night on the calendar, others count only nights that were actually listed as available.
What Is a Good Airbnb Occupancy Rate?
A good Airbnb occupancy rate for most US short-term rentals sits between 50% and 70% annually. Below roughly 45% you are usually mispriced, poorly positioned in search, or competing in an oversupplied market. Above 80% year-round is often a warning sign rather than a win — it typically means your nightly rate is set too low.
- Under 45%: investigate pricing, photos, review count, and minimum-stay rules
- 50-70%: the healthy band for most year-round US markets
- Above 80%: test a rate increase — you are likely leaving money on the table
Seasonal markets break these rules on purpose. A ski cabin doing 90% in winter and 25% in summer can out-earn a steady 65% property, because the winter nights sell at three times the rate. This is why occupancy is never read alone — see the metric comparison below.
Property type shifts the band too. A studio in a dense downtown competes on volume and should sit at the top of the range; a five-bedroom lake house competes on a handful of high-value weeks and can be profitable at 40%. If you are still choosing a property, our Airbnb business plan guide walks through modelling both cases before you buy.
Airbnb Occupancy Rate vs Vacancy Rate
Vacancy rate is simply the mirror image of occupancy rate: the two always add up to 100%. A listing at 62% occupancy has a 38% Airbnb vacancy rate. Nothing more complicated is going on, but the framing changes what you notice.
- Occupancy rate — what you sold. Useful for benchmarking against a market.
- Vacancy rate — what you did not sell. Useful for costing the gap.
- Why it matters: “38% vacancy” on a $150 property reads as ~$1,710 of unsold nights a month; “62% occupancy” reads as a pass mark. Same number, very different urgency.
Read vacancy alongside the shape of the empty nights. Thirty scattered single nights and one dead fortnight both produce the same vacancy rate, and they need opposite fixes — the first is a minimum-stay problem, the second is a demand or pricing problem.

Average Airbnb Occupancy Rates by City in 2026
Occupancy varies more by market than by anything a host controls. According to , the US national average sat at roughly 50% in spring 2026, with individual markets spread far around it.
| Market | Occupancy rate (April 2026) | Read |
|---|---|---|
| Honolulu, HI | 65% | Year-round destination demand |
| Washington, DC | 63% | Business plus tourism mix |
| Miami, FL | 62% | Strong but seasonal peaks |
| Los Angeles, CA | 62% | Deep, steady demand |
| Fort Lauderdale, FL | 58% | Coastal, season-weighted |
| San Diego, CA | 57% | Mild year-round season |
| Seattle, WA | 55% | Summer-weighted |
| Chicago, IL | 52% | Sharp summer peak |
| Nashville, TN | 50% | Event-driven, high supply |
| Houston, TX | 50% | At the national average |
| Atlanta, GA | 49% | Oversupplied in parts |
| Philadelphia, PA | 49% | Weekend-weighted |
| Hilton Head Island, SC | 44% | Heavily seasonal |
| Myrtle Beach, SC | 39% | Summer concentrated |
| Ocean City, MD | 34% | Short, intense season |
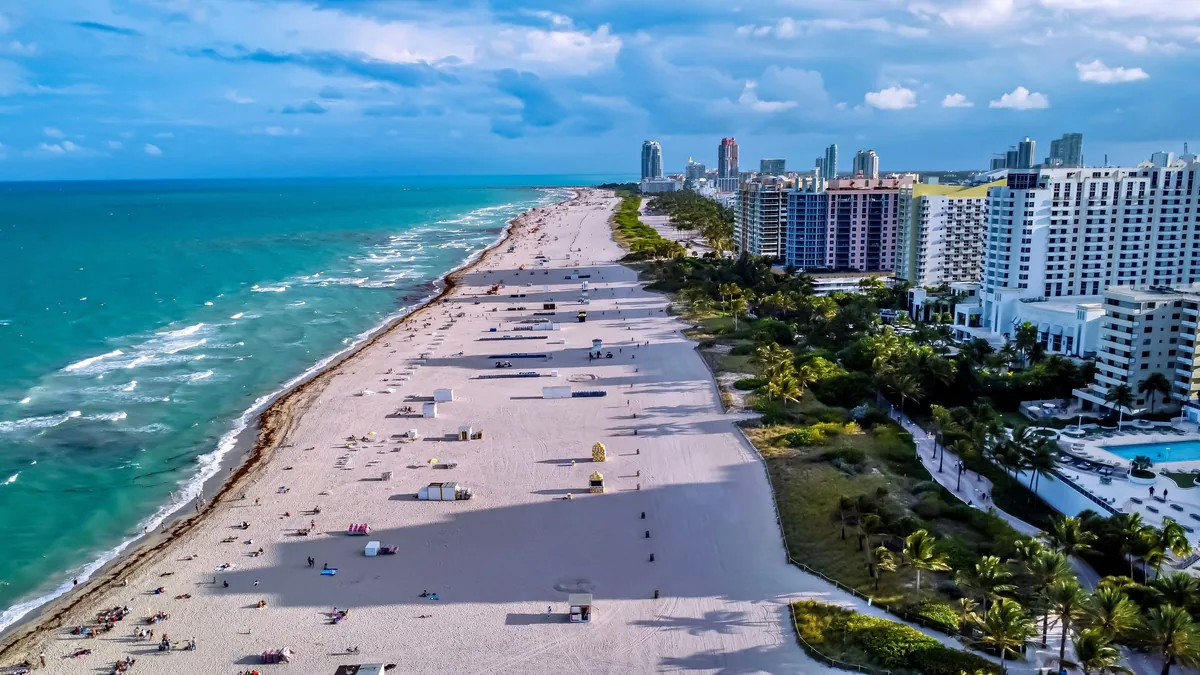
Two things to take from this table. First, a 50% average Airbnb occupancy rate in Nashville is not the same result as 50% in Ocean City — one is a soft year, the other is a normal one. Second, comparing your property to a national figure is close to meaningless. Compare it to your own market and your own season.
Highest Airbnb Occupancy Rates: Which US Markets Lead
The markets posting the highest Airbnb occupancy rates in 2026 share one trait: demand that does not switch off. Honolulu at 65% and Washington, DC at 63% top the list above, and neither depends on a single season — Hawaii draws travelers year-round, DC layers government and business travel on top of tourism.
What high-occupancy markets have in common:
- More than one demand driver — leisure plus business, or tourism plus events
- Supply constraints — regulation or geography limiting new listings
- Shoulder-season travel — a reason to visit in March and October, not just July
The practical lesson for a host: you cannot move your property to Honolulu, but you can find the second demand driver in your own market and build the listing around it. Properties near a hospital, a university, or a convention center have midweek demand that pure-leisure listings never see.
Airbnb Occupancy Rate Calculator: Find Your Own Number
You do not need a tool for this. Count the nights you sold in a 30-night month, find the row, and read across. The third column is what the number is actually telling you.
| Nights booked (of 30) | Occupancy rate | What it means |
|---|---|---|
| 9 | 30% | Well below market — check price, photos and minimum stay |
| 12 | 40% | Below average for a year-round market; normal for a seasonal one |
| 15 | 50% | The US national average in spring 2026 |
| 18 | 60% | Inside the healthy band |
| 21 | 70% | Top of the healthy band |
| 24 | 80% | Strong — test a rate increase |
| 27 | 90% | Almost certainly underpriced |
For a different month length, divide booked nights by available nights and multiply by 100. A 31-night month with 20 sold is 20 ÷ 31 × 100 = ~64.5%. A month where you blocked 6 nights for yourself has 24 available, so 15 sold is 15 ÷ 24 × 100 = 62.5%, not 50%.
Run it monthly and keep the twelve numbers in one column. The annual average is the least useful figure in the whole exercise — it is the two worst months that decide your year.

How to Find Airbnb Occupancy Rates for Your Market
Hosts searching for Airbnb occupancy data usually want one of two different things: their own listing’s number, or the market benchmark to compare it against. These come from different places.

| Source | What it gives you | Cost |
|---|---|---|
| Airbnb host dashboard | Your own booked vs available nights | Free |
| AirDNA | Market-level occupancy, ADR, RevPAR by city and ZIP | Paid, limited free view |
| Mashvisor | City and neighborhood occupancy estimates | Paid, limited free view |
| Your own spreadsheet | The only number nobody can get wrong | Free |
| One Fine BnB | Market analysis for your address, before you commit | Free consultation |
To calculate your own rate, pull your booked nights from the Airbnb calendar for a set period, count how many nights the listing was actually open, and divide. Do it monthly rather than annually — an annual figure hides the two months that are quietly killing your year.
One caution on paid market tools: they estimate from public calendar data, so a blocked night and a booked night can look identical to a scraper. Treat market figures as a benchmark, not gospel, and trust your own dashboard for your own property. Airbnb’s listing performance documentation explains what the platform itself reports back to you.
Airbnb Occupancy Rate vs ADR and RevPAR
Occupancy on its own can mislead badly. Professional revenue managers read it alongside two companion metrics, and the third one is the metric that actually pays you.
| Metric | What it measures | What it misses |
|---|---|---|
| Occupancy rate | Share of available nights sold | What you sold them for |
| ADR (average daily rate) | Average price per booked night | How many nights sold |
| RevPAR (revenue per available night) | Occupancy × ADR — the combined result | Nothing; this is the scoreboard |
Myth: the goal is to push occupancy as high as possible.
Reality: the goal is to maximise RevPAR. A listing at 90% occupancy and $110 ADR earns $99 per available night. The same listing at 70% and $160 earns $112 — fewer guests, less cleaning, less wear, more money.
Myth: a low occupancy rate means the market is saturated.
Reality: far more often it means the price is wrong for the season, or the minimum-stay rule is blocking the bookings that were available. Both are fixable in an afternoon.
How Occupancy Rate Affects Revenue: A Worked Example
Meet Dana. She owns a two-bedroom condo in Nashville listed at $150 per night, available 340 nights a year after her own use. Her numbers are illustrative, but the arithmetic is exact.
- Before: 55% occupancy — 187 booked nights × $150 = ~$28,050 gross
- After: 68% occupancy — 231 booked nights × $150 = ~$34,650 gross
- Difference: 44 extra nights = ~$6,600 more revenue, same property, same rate
Dana did not raise her price to get there. She shortened her minimum stay from three nights to two on midweek dates, switched on dynamic pricing, and cut her response time to under an hour. Those three changes opened up the gap nights that her old settings had been quietly refusing.
Now read it as RevPAR: $28,050 ÷ 340 = ~$82.50 per available night before, $34,650 ÷ 340 = ~$101.91 after. That is the number to track month over month.
How to Improve Your Airbnb Occupancy Rate
The levers below are ordered by how fast they take effect. The first three can be changed today; the last two compound over months.
- Fix the minimum-stay rule first — a three-night minimum on a market that books two-night weekends removes half your inventory before pricing even matters
- Turn on dynamic pricing — a static rate cannot follow local events and seasonality; see our guide to dynamic pricing for Airbnb
- Answer faster — response speed feeds search placement, and enquiries do not arrive during office hours
- Rebuild the photo set — the cover image decides whether your listing gets clicked at all
- Protect your review flow — review count and rating compound into placement, which compounds into occupancy; see how Superhost status works
Fees are part of this too. A cleaning fee that looks high next to the nightly rate suppresses short bookings, which is exactly where gap nights live. Airbnb’s own explainer on how pricing works for homes shows the total a guest actually sees — which is rarely the number hosts think they are advertising.
Search placement feeds all of this. Airbnb names availability, price relative to comparable listings, and host responsiveness among the factors that affect where a listing appears in search results — three inputs that are also occupancy levers. Tighten the listing itself with our Airbnb listing optimisation tips, and keep the review engine running with a consistent guest review template.
If pricing is where you want to start, revenue management and rate optimisation covers the discipline behind the tooling.
Mistakes Hosts Make With Occupancy Rate
- Counting blocked nights as available. It understates your real occupancy and sends you chasing a problem that does not exist.
- Reading the annual number only. A 62% year can hide two months at 20%. The fix lives in those two months, and the annual figure hides them.
- Chasing occupancy with discounts. Dropping the rate to fill the calendar raises occupancy and lowers RevPAR — you work more for less.
- Comparing against the national average. The number that matters is your market and your season, not a US-wide figure.
- Ignoring midweek entirely. Most hosts optimise weekends and let Monday through Thursday sit empty. That is where the recoverable nights are.
- Letting turnover quality slide as occupancy climbs. More bookings means more cleans, and a slipping standard shows up in reviews within weeks — which drags placement, which drags occupancy back down. A repeatable cleaning checklist is what keeps the gain.
- Comparing Airbnb occupancy to Vrbo without adjusting for fees. The platforms price differently; see Vrbo host fees before concluding one channel outperforms the other.
How One Fine BnB Improves Occupancy Rate
One Fine BnB reports that its managed listings achieve a 51% higher occupancy rate than the market average. The mechanism is not a secret: AI-driven dynamic pricing that reads seasonal demand, local events, and comparable listing performance, combined with distribution across 25+ booking sites and 24/7 guest support so enquiries never sit overnight.
Founded in 2010, the company works on two management models: Full Service Management at 20% of rental income, and Partner Management at 10% for owners who keep their own local cleaning and on-site team. A one-time $500 onboarding retainer covers setup — professional photography, listing creation, and property preparation. After that, One Fine BnB only gets paid when the owner gets paid, with no long-term contracts. For context, the industry range runs 25-50% of rental income.
The track record behind it: a $2.3B+ managed portfolio, 92% owner retention, and a 4.9/5 average guest rating across 16 years. See the full breakdown of management fee structures or how professional Airbnb property management works.
Frequently Asked Questions
What is a good occupancy rate for an Airbnb?
Most well-run US short-term rentals land between 50% and 70% annually. Vacation markets swing far wider by season, so judge yourself against your own market rather than a national figure.
How do I calculate my Airbnb occupancy rate?
Divide booked nights by available nights and multiply by 100. Exclude nights you blocked for personal use — those were never for sale, and counting them makes your rate look worse than it is.
Does a higher occupancy rate always mean more revenue?
No. Occupancy multiplied by ADR gives RevPAR, and RevPAR is what lands in your account. Filling the calendar with discounted nights can raise occupancy while lowering what you actually earn.
Does seasonal demand always reduce annual occupancy?
Not necessarily. Markets with several demand drivers — summer beach traffic, fall foliage, holiday events, winter snowbirds — often hold steadier annual occupancy than single-season destinations.
How often should I check my occupancy rate?
Monthly. An annual number tells you what happened; a monthly one tells you which month to fix while there is still time to fix it.
Sources and Method
City-level figures in this guide come from and reflect April 2026. Market benchmarks move, so treat them as a reference point for comparison rather than a target. Platform behaviour is cited from Airbnb’s own help documentation, linked inline where it appears.
The Dana example and the calculator rows are illustrative — the arithmetic is exact, the property is not real. One Fine BnB performance figures are the company’s own reported numbers and are labelled as such. Nothing in this guide is a projection of what a specific property will earn.
Related Airbnb Terms
Occupancy rate is the foundational metric, but it sits inside a wider system. Dynamic pricing is the lever that moves it. Short-term rental defines the category. A co-host or a professional manager is who runs it when you cannot. Compare local options through our local management directory, in Nashville, Denver, or Scottsdale, or find Airbnb management near you. Guest-side expectations matter as much as your numbers — see how guest reviews work. More answers sit in the vacation rental management FAQ, and Airbnb’s overview of how the platform works covers the basics.

Written by
Kent Morgan
Kent Morgan is the founder and president of One Fine BnB, a short-term rental management company running hundreds of vacation rentals from its Austin home base, with properties in several U.S. markets and internationally. The portfolio ranges from single condos to homes well over $2 million, which are managed on a dedicated luxury service tier. A San Diego native, he founded his first STR management company in New York in 2011 and has lived in most of the markets he's since grown into — NYC, the Florida beaches, Nashville, Las Vegas, Palm Desert, and Southern California. His companies have been early testers and development partners for major OTAs and short-term rental platforms.


